This guide explains what uptime monitoring actually does, where its limits are, and what fills the gaps it leaves.
What Uptime Monitoring Does
At its most basic, uptime monitoring does one thing: it sends an HTTP request to your website on a schedule and checks whether it gets a valid response back.
The monitor visits your URL (say, https://yoursite.com) every few minutes. If the server responds with a status code in the 200–399 range, the check passes and your site is marked as "up." If the server doesn't respond, responds too slowly, or returns a 4xx or 5xx error, the monitor marks the site as "down" and sends an alert.
That's it. It's a simple handshake: "are you there?" — "yes."
What uptime monitoring tells you:
- Whether your server is responding at all
- Whether your site is returning critical errors (500, 503, etc.)
- Your site's response time (how long the server takes to respond)
- Historical uptime percentage over time
These are useful signals. When your server is genuinely down — hosting outage, database crash, misconfigured DNS — uptime monitoring is the fastest way to know.
What Uptime Monitoring Can't Tell You
Here's where most site owners run into trouble: they assume uptime monitoring means their site is working. It doesn't.
Uptime monitoring checks whether the server is responding. It knows nothing about what's actually rendered in the browser. It doesn't execute JavaScript. It doesn't fill out forms. It doesn't click buttons. It doesn't verify that your checkout works.
Uptime monitoring cannot detect:
JavaScript errors. Your checkout's payment form is driven by JavaScript. If a JS error prevents the payment form from loading, customers can't pay — but the server still returns a 200 OK. The monitor sees a healthy site.
Broken user flows. Your login page loads fine. But a session misconfiguration means users who log in get redirected back to the login screen in a loop. The uptime monitor sees a page that loads. It can't see what happens when a user tries to log in.
Hidden buttons. A plugin update moves your "Buy Now" button off-screen or hides it behind another element. The page loads. The server responds. The button is effectively gone.
Missing form fields. A deploy accidentally removes a required field from your contact form. Users fill out the remaining fields, submit, and get an error. The uptime monitor doesn't know the field was there.
Third-party failures. Your checkout depends on a Stripe.js script loaded from Stripe's servers. If that script fails to load — due to a network issue, a blocked resource, or a Stripe outage — your payment form doesn't appear. The server is fine. The uptime monitor is green.
Content failures. Your product page is supposed to show three pricing tiers. After a data migration, it shows zero. The page loads. The data isn't there.
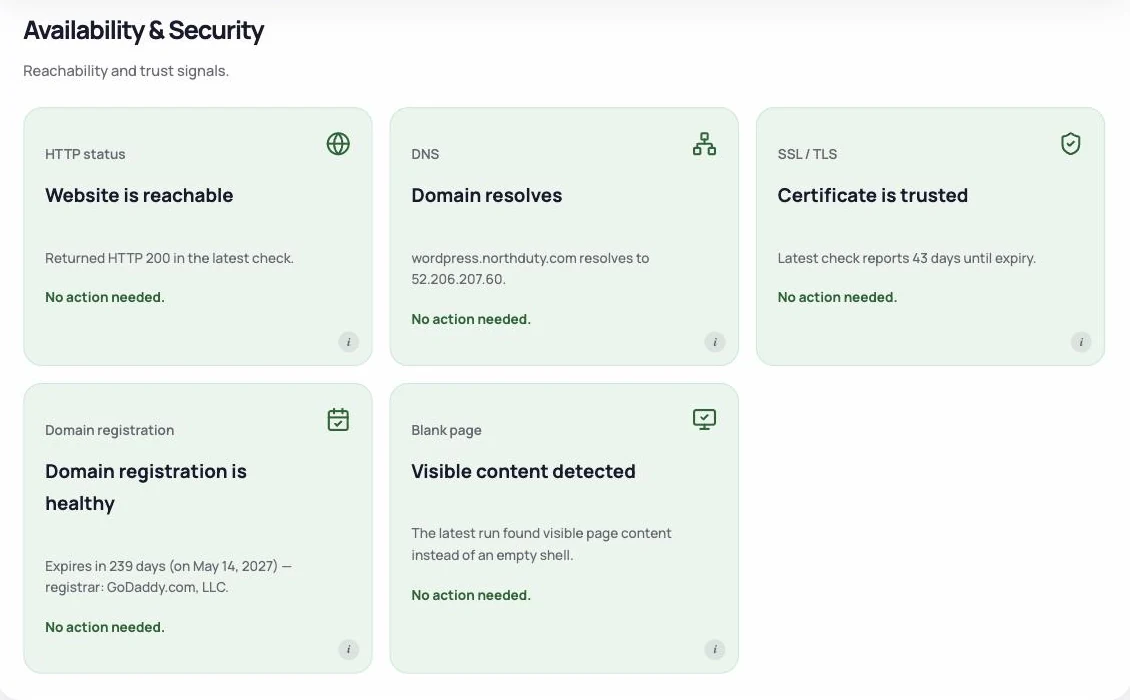
The Gap Between "Up" and "Working"
There's a meaningful difference between a site that's up and a site that's working for users. Uptime monitoring only covers the first definition.
A server can be "up" while:
- The checkout is broken
- Users can't log in
- Forms won't submit
- Key content is missing
- The mobile layout is completely broken
In every one of these cases, the uptime monitor shows green. This is why "my uptime monitor shows no issues" isn't the same as "my site is working."
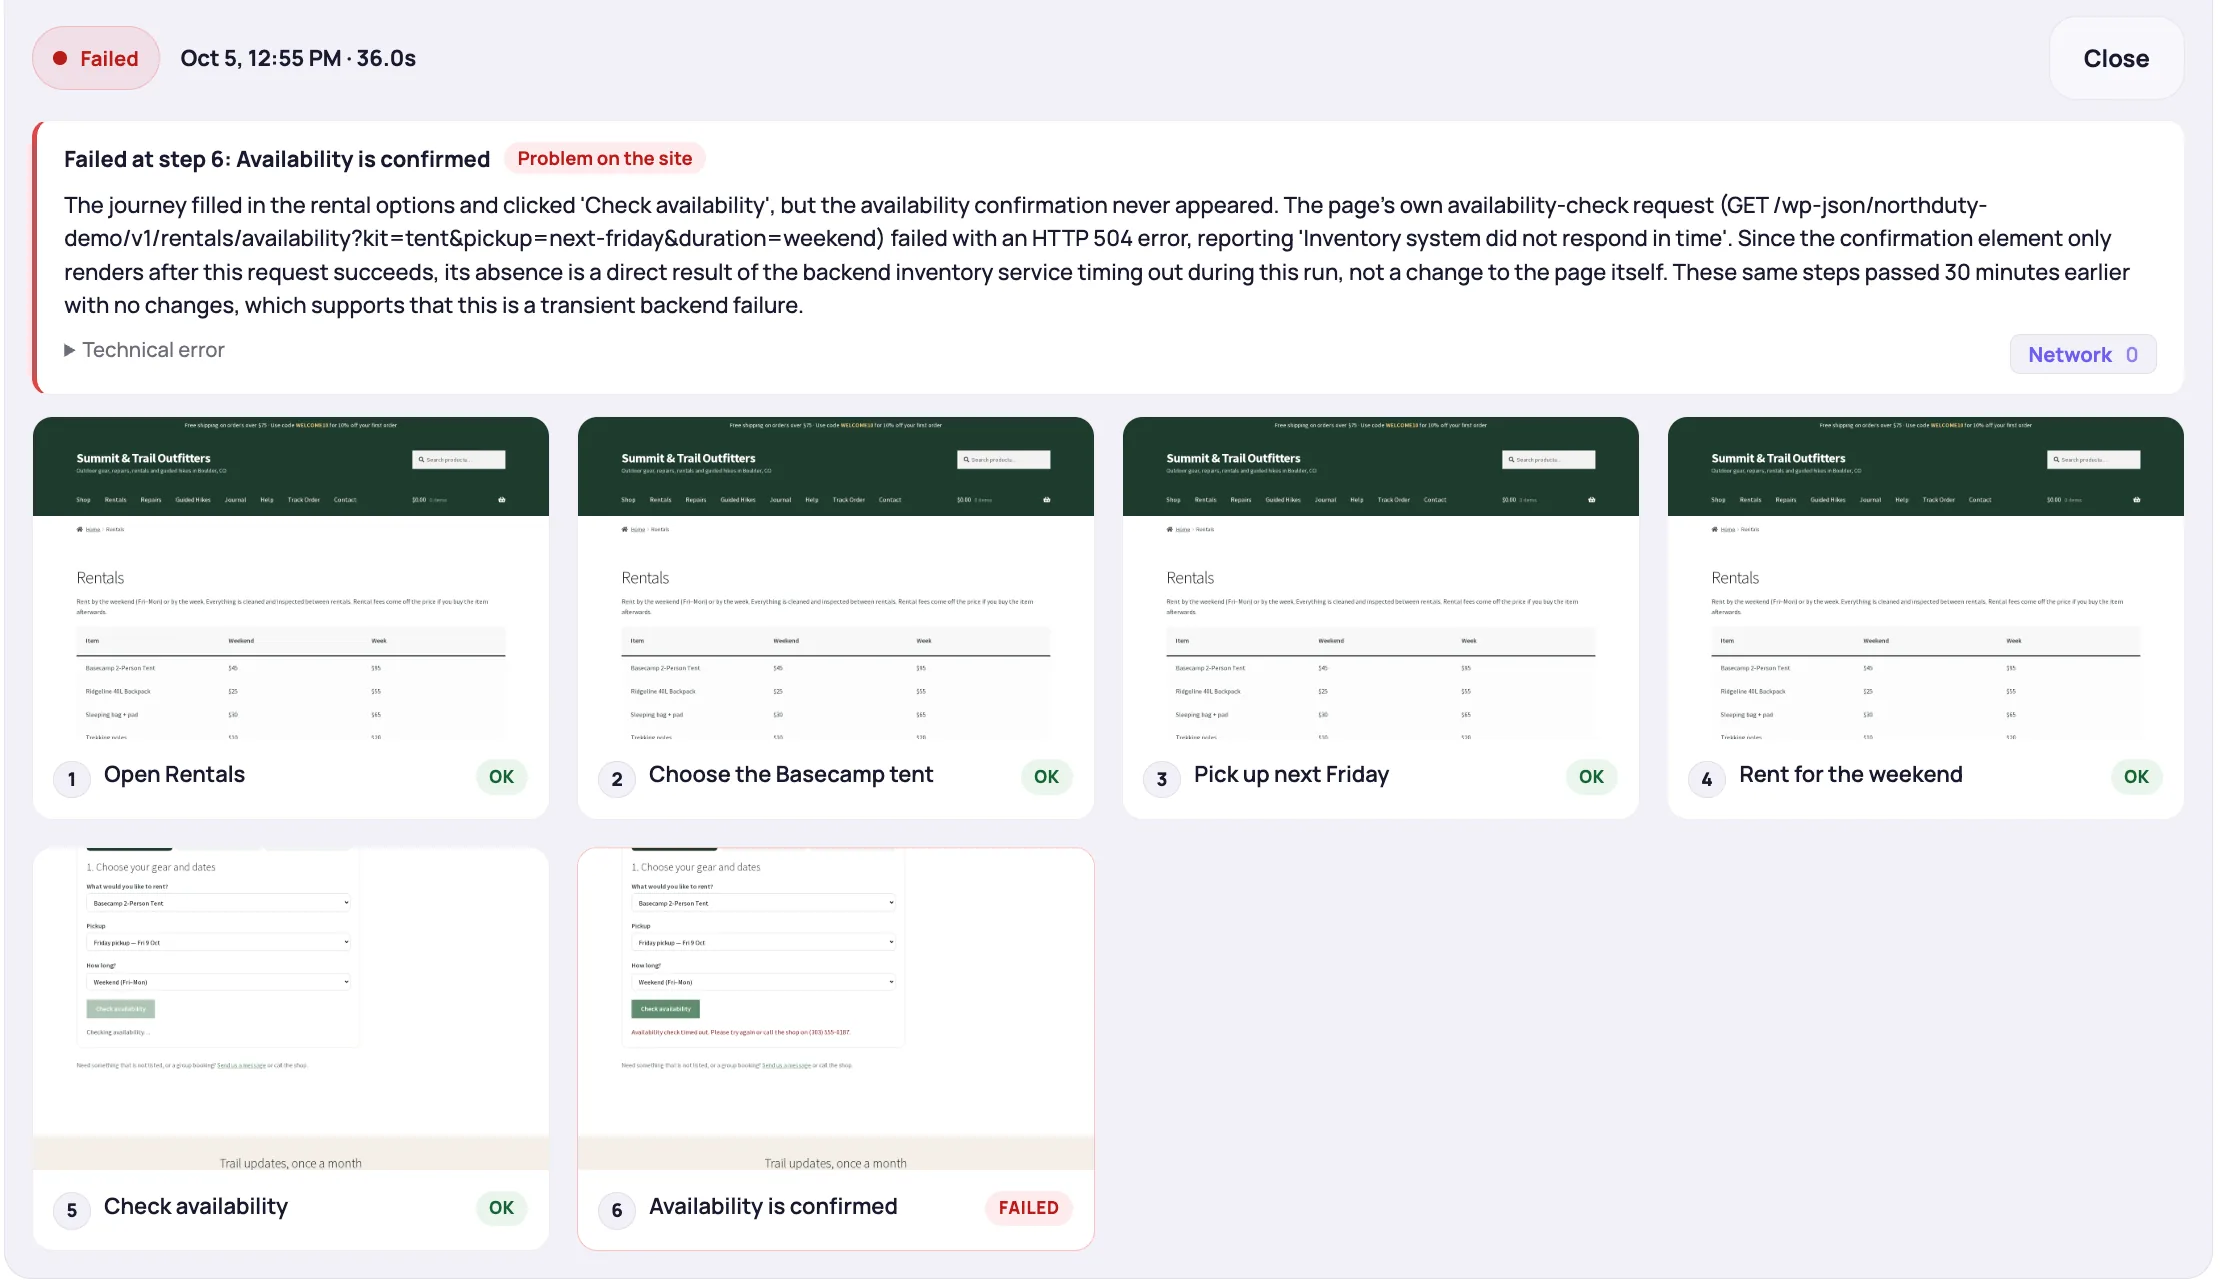
What Fills the Gap
Two complementary approaches address what uptime monitoring misses:
Rendered health checks load your key pages in a real browser and look at what actually happened. If a deploy or update throws a JavaScript error, stops a script or stylesheet from loading, breaks an API call the page depends on, or leaves the page blank, the check flags it. This covers the rendering layer that uptime monitoring ignores.
User journey monitoring goes further. Instead of just checking whether a page loads, it steps through a sequence of actions — loading a product, adding it to cart, reaching checkout, verifying the form is present — and confirms that each step reaches the expected outcome. This covers functional behavior that neither uptime monitoring nor page-level health checks can verify.
NorthDuty offers both. It checks uptime, runs rendered health checks on your pages, and lets you define user journeys in plain English to verify that critical flows still work. Together, these layers give you a more complete picture of whether your site is actually working — not just whether the server is responding.
For a deeper look at the comparison between monitoring approaches, see Synthetic Monitoring vs Uptime Monitoring and How to Monitor a SaaS Product's Critical User Flows Without Writing Code. For the gaps themselves, read about API monitoring and how visual regression testing differs from journeys, and for the setup side, how to monitor website uptime.
Should You Still Use Uptime Monitoring?
Yes. Uptime monitoring is fast, reliable, and catches the most severe failure mode: your server going down entirely. Server outages are real events, and you want to know about them immediately.
The point isn't that uptime monitoring is useless — it's that it's insufficient on its own. A server that's responding is a precondition for a working site, not evidence that the site is working.
Layer uptime monitoring with rendered health checks and user journey monitoring, and you go from knowing your server is alive to knowing your site is actually functional for users.
Summary
Uptime monitoring checks whether your server responds to HTTP requests. It's valuable for catching server outages and critical errors. But it can't see JavaScript failures, broken user flows, hidden buttons, or missing content — because all of these happen in the browser, after the server has already responded successfully. For a complete picture of site health, uptime monitoring needs to be paired with tools that verify the user experience directly.