A deployment can introduce failures that have nothing to do with server availability. The server responds. The page loads. The uptime monitor stays green. But somewhere in the browser, something is broken for your users.
Here are the five most common post-deploy failures that slip past standard uptime monitoring.
1. JavaScript Errors That Break Interactive Elements
Modern websites rely heavily on JavaScript for interactive behavior: form submissions, cart updates, modal dialogs, navigation menus, payment forms. When a deploy introduces a JavaScript error — a syntax mistake, a broken import, a library version conflict — these elements can stop working without any visible indication.
The page loads. The elements are there. But clicking the submit button does nothing. The cart won't update. The form won't send.
A JS error doesn't return a server error code. It happens in the browser, after the server has already responded successfully. Uptime monitoring — which operates at the HTTP level — has no visibility into this.
How to catch it: User journey monitoring that steps through interactive flows will catch these failures because it verifies that actions produce the expected outcomes, not just that pages load.
2. Missing or Broken UI Elements
A deploy can accidentally remove an element from a page: a button, a form field, a navigation item, a call-to-action section. This can happen through a template error, a merge conflict, a feature flag that accidentally hid more than intended, or a CSS change that moved an element off-screen.
The server serves the page. An uptime monitor gets a 200 OK. But the "Get Started" button is gone, or the checkout form has lost its submit button.
How to catch it: A user journey that clicks the button or fills in the form fails at the exact step where the element went missing, with a screenshot of what the page actually showed.
3. Redirect Chains and Misconfigured Redirects
Deploys often include changes to URL structures, routing rules, or redirect configurations. A misconfigured redirect can create a loop (A redirects to B, B redirects to A), a chain of unnecessary hops that degrades performance, or a broken destination that lands users on a 404.
Some uptime monitors follow redirects — but they don't verify that the final destination is the right one. A redirect that resolves to a 200 OK but lands on the wrong page (or an empty page) passes the check.
How to catch it: Monitoring specific user journeys — including visiting a URL and verifying that the final page contains expected content — catches redirect failures that uptime checks miss.
4. Third-Party Script Failures
Most production websites load scripts from third-party providers: payment gateways, analytics tools, chat widgets, A/B testing platforms, tag managers. These scripts are often loaded asynchronously, which means a failure in one of them can cause cascading problems — blocking other scripts, interfering with page rendering, or making interactive elements unresponsive.
A deploy that updates how these scripts are loaded — a new tag manager configuration, a changed script URL, an updated integration — can break functionality in ways that are specific to certain browsers, certain user flows, or certain pages.
How to catch it: Running user journey checks after every deploy, across the critical flows that depend on these scripts, surfaces failures that wouldn't appear in server logs or uptime dashboards.
5. API and Backend Service Timeouts
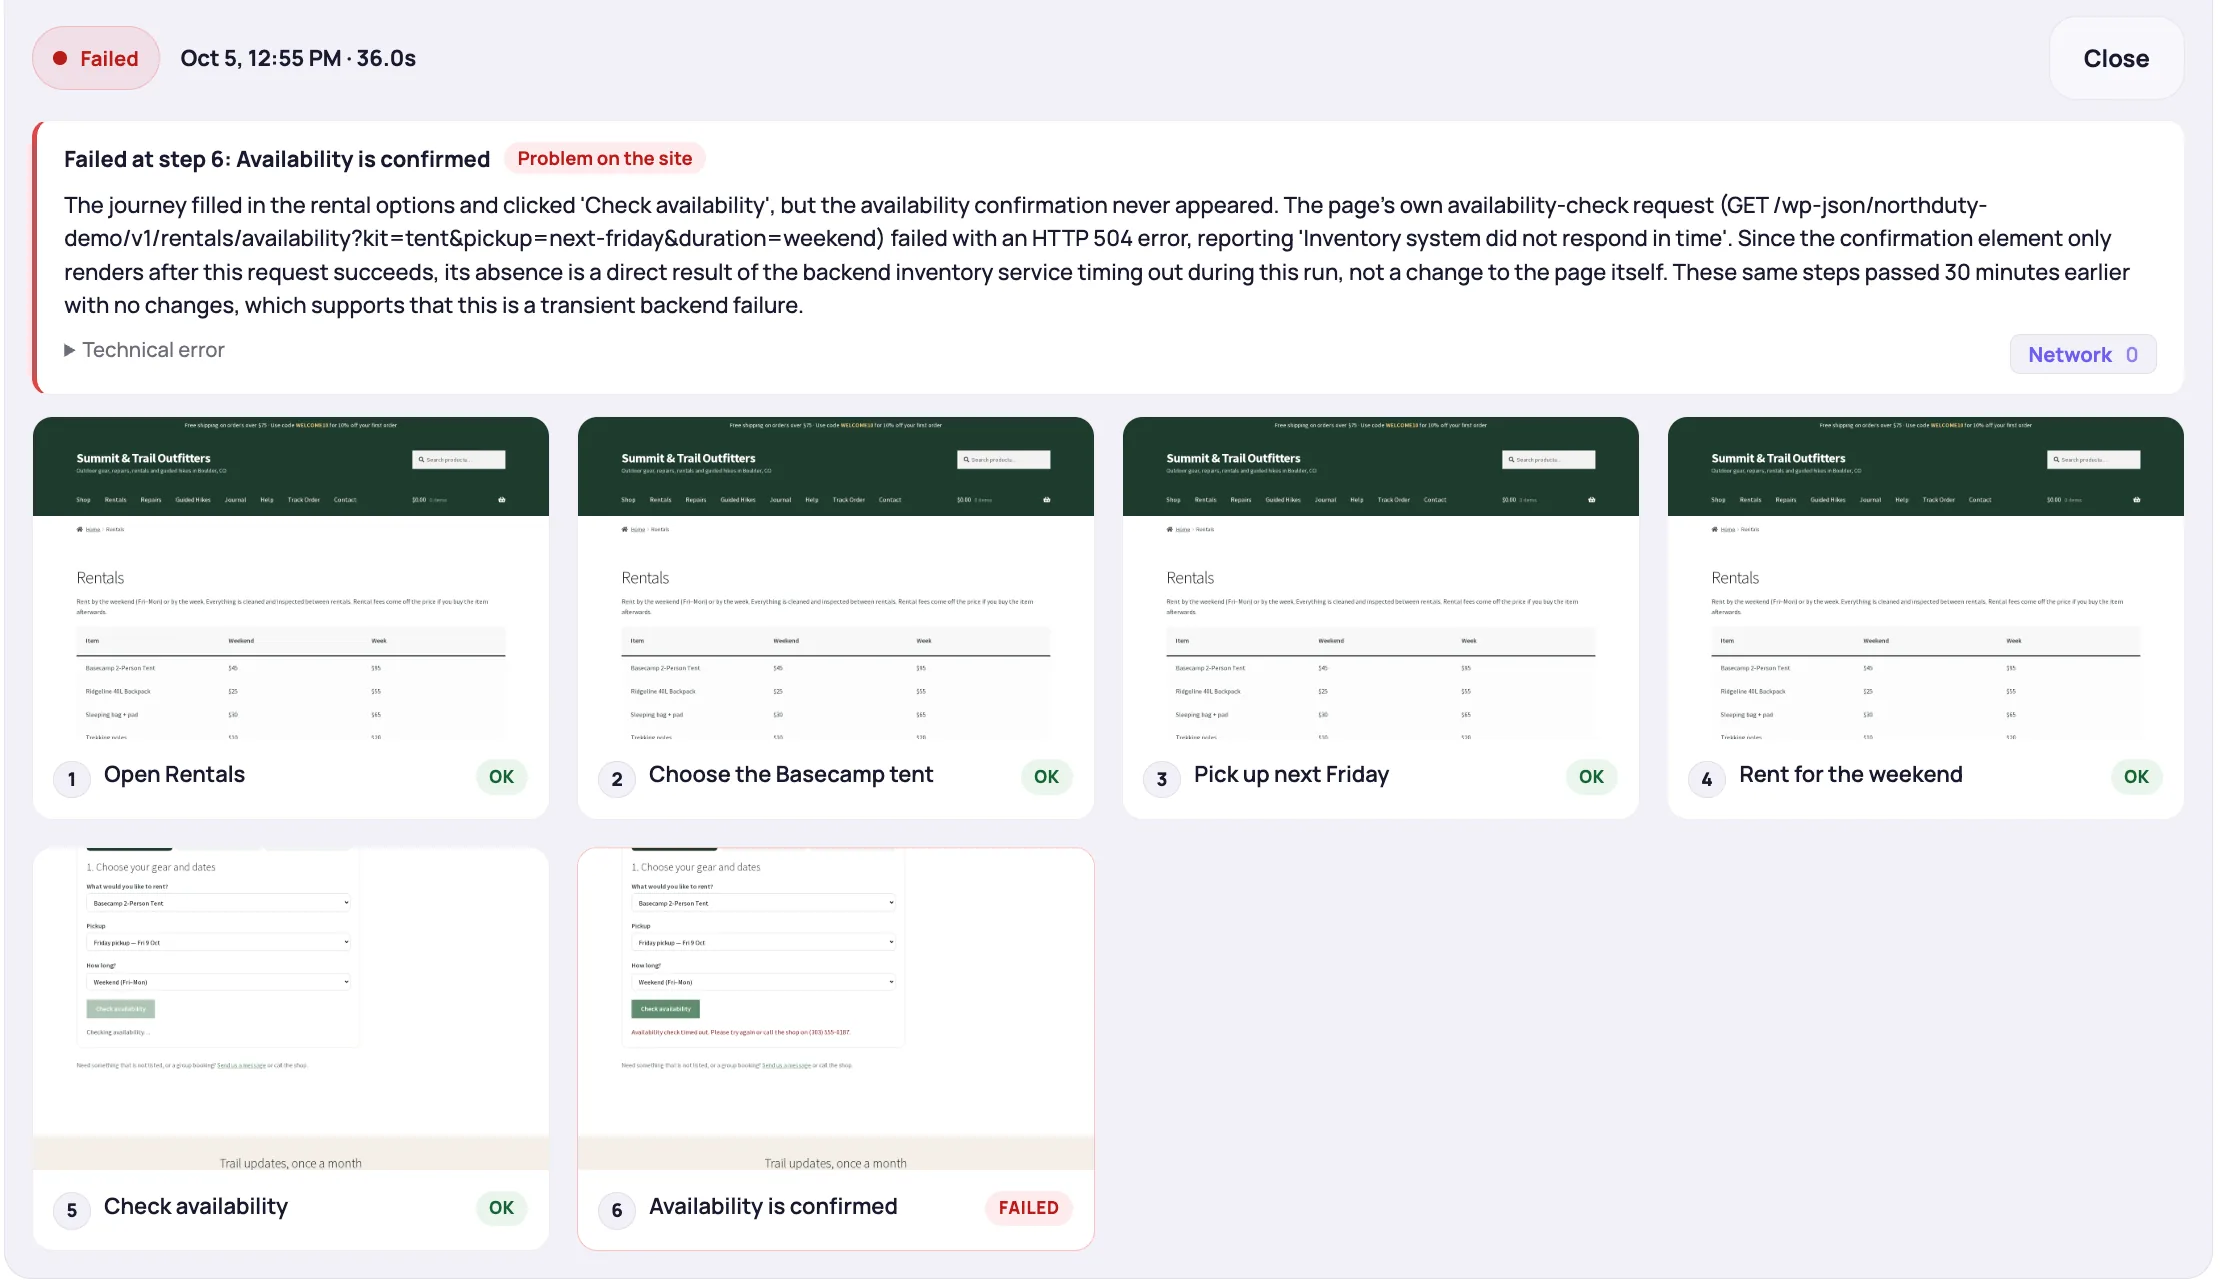
Many frontend pages depend on backend services or external APIs to populate their content: product prices pulled from an inventory system, user data fetched from a microservice, recommendations loaded from a recommendation engine. A deploy that changes the contract between the frontend and these services — updated API endpoints, changed authentication, modified response formats — can cause these requests to fail silently.
The page loads. But the products don't appear. The prices are missing. The checkout can't fetch shipping rates.
These failures often don't produce server errors at the page level — the page itself loads fine; it's the data-fetching requests that fail. Uptime monitoring doesn't check these.
How to catch it: Journey monitoring that verifies specific page states — not just that a page loaded, but that expected content is present — catches these data-layer failures.
The Common Thread
All five of these failures share something: they produce a 200 OK response from the server while the user experience is broken. Standard uptime monitoring declares them all healthy. Rendered health checks catch the ones that throw JavaScript errors, fail to load resources, or break the API calls a page makes. User journey monitoring catches the ones that break interactive behavior.
NorthDuty combines rendered health checks and user journey monitoring to cover both. After a deploy, it can tell you whether your key pages render without errors and whether your critical flows still work — not just whether your server is responding.
For how visual regression testing differs from journey monitoring, see What Is Visual Regression Testing? A Plain-English Guide for Non-Developers. For post-deploy monitoring specifically, see Post-Deploy Monitoring: Know Within Minutes If Your Deploy Broke Something. Each failure type above has a deeper guide: API monitoring for the endpoints your site depends on, how to monitor JavaScript errors on a website, and how to monitor website redirects.
Building a Post-Deploy Verification Habit
You don't have to catch every possible failure manually. The goal is to automate the checks that matter most:
- Run health checks against your key pages immediately after every deploy
- Run user journey checks against your critical flows (login, checkout, signup, contact form) after every deploy
- Set alert thresholds that notify the right person immediately — not after the failure has been running for hours
Deploys are necessary. Regressions are not. The gap between "the deploy went out" and "we know it didn't break anything important" should be measured in minutes.